Select Page
AstraZeneca COVID Vaccine Still Works, Even Though Their Marketing Tactics Don’t

AstraZeneca COVID Vaccine Still Works, Even Though Their Marketing Tactics Don’t

AstraZeneca COVID Vaccine Still Works, Even Though Their Marketing Tactics Don’t 

Thursday, March 25th, 2021

  • Clinical trial monitors for AstraZeneca’s COVID vaccine claim that data was outdated and potentially misleading.
  • Yet, the data AstraZeneca released still shows that the vaccine is 76% efficacious at preventing symptomatic COVID.
  • The way AstraZeneca handled the data release was a PR disaster, but the data has not materially changed. AstraZeneca’s vaccine is about 76% effective.
  • The USA has sufficient supply of vaccines produced by other companies. Other countries like Canada and the UK will have to rely on AstraZeneca much more.

Pharma giant AstraZeneca has been under fire recently for controversy of their COVID vaccine. At first, concerns about the safety of the vaccine were questioned when blood clots were reported after receiving the shot. The Netherlands, Norway, Iceland and Denmark went as far as suspending use of the vaccine due to the clotting.

However, the company came out with a press release in mid-March claiming that, from a review of >17 million people vaccinated in the European Union and UK, there is no increased risk of blood clotting.

AstraZeneca’s Latest Marketing Misstep

Less than two weeks later, independent monitors of the vaccine trial put into question the validity of the data released by the company. They claimed that it was “outdated and potentially misleading”.

While AstraZeneca claims that their vaccine is 79% effective, the monitors found that, with addition of an extra month of the trial, the efficacy actually ranged from 69%-75%. The Data and Safety Monitoring Board (DSMB) feels as though the company put out data that is most favourable towards their vaccine, rather than the most recent and updated.

As a response, AstraZeneca primary analysis on early Thursday morning and the results were still consistent, but not identical, with their interim analysis. The Phase III trial of their candidate, AZD1222, in a North American study showed “76% efficacy at preventing symptomatic COVID and 100% efficacy at preventing severe disease and hospitalization”. The trial included >32,000 participants, 190 of which had symptomatic COVID. It was well tolerated with no safety concerns identified by the DSMB, and even showed 85% efficacy in those who are 65 years and older.

So What Really Changed?

The number of COVID cases included in the “Primary Analysis” was higher than the “Interim Analysis”. As a result, efficacy fell from 79% to 76%. Not a material difference. 
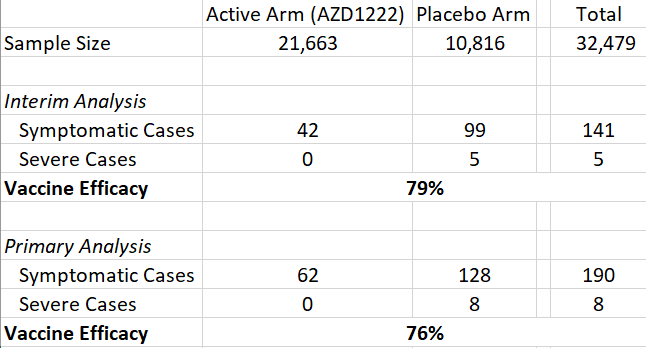
It is also important to note that efficacy in the 65+ age rose from 80% in the “Interim Analysis” to 85% in the “Primary Analysis”. Again, not materially different.

However, there are 14 additional possible or probably cases that have not been included in either analysis and may still cause the efficacy number to fluctuate a bit. This would increase the total number of COVID cases from 190 to 204. Below is how the efficacy number would change in 3 different scenarios.

As you can see, the numbers do not change materially. The most likely scenario is that the 14 COVID cases are split, which would result in a vaccine efficacy somewhere in the mid-70% range.

What Does It All Mean for AstraZeneca’s Vaccine?

AstraZeneca plans to submit their vaccine for Emergency Use Authorization (EUA) with the FDA sometime in mid-April. Before the FDA grants AstraZeneca approval, full details of the vaccine development program will be available in the briefing documents ahead of the Vaccines and Related Biological Products Advisory Committee (VRBPAC) meeting. This is where an FDA committee will review and evaluate the vaccine data.

In the USA, AstraZeneca’s VRBPAC meeting will not materially change much for Americans looking to get dosed. Currently, there is sufficient supply of Pfizer, Moderna and Johnson & Johnson’s COVID vaccines available to Americans.

The same cannot be said for other countries such as Canada, the UK and EU. These countries will be more reliant on AstraZeneca’s vaccine due to the lack of available supply of the other COVID vaccines.

AstraZeneca will release the results of their analysis in late March. Vaccine efficacy is expected to come in the mid-high 70% range, with no significant safety concerns. For those willing to wait, a full data review of AstraZeneca’s vaccine will be provided by the FDA’s VRBPAC meeting in April. However, those with limited options have to remember that in times of a pandemic, any vaccine is better than nothing.
New Weight Loss Paradigm: Diabetic Drugs Showing Promise As Treatments

New Weight Loss Paradigm: Diabetic Drugs Showing Promise As Treatments

New Weight Loss Paradigm: Diabetic Drugs Showing Promise As Treatments

Monday February 22nd, 2021

  • An anti-diabetic drug, semaglutide, used for treatment of type 2 diabetes has shown to help reduce 15% of body weight over a 68-week period
  • In a Phase 3 study, semaglutide demonstrated superior efficacy and convenience with once weekly injection. However, the drug will likely be expensive as the lower approved dose to treat diabetes costs $1,000/month.
  • The drug is under FDA review and a verdict is expected by mid-2021
  • Another anti-diabetic drug, tirzepatide, has also reduced weight by 13.9% in clinical trials

An anti-diabetic drug used for treatment of type 2 diabetes has shown to help reduce 15% of body weight over a 68-week period (or 1.3 years). The drug is Ozempic (semaglutide) and sold by large pharma company Novo Nordisk. In December 2017, Ozempic was approved for type 2 diabetes as a 1mg weekly injection. While studying Ozempic for type 2 diabetes, weight loss was observed in obese patients. This prompted studying the drug as a weight loss treatment. It is now under FDA review to be used as an anti-obesity drug at a 2.5mg, once weekly dose.

The Weight Loss Study

The Phase 3 study, called STEP1, enrolled 1961 adults with a body mass index (BMI) of 30 or more. For context, a BMI between 18.5-25 is considered “normal weight” (see image below). 2/3rd of the patients received semaglutide injections once weekly and the other 1/3rd received a placebo.

In addition to the drug, participants received individual counseling sessions to help them adhere to a reduced calorie diet (500-kcal deficit per day) and increased physical activity (150 minutes per week).

The primary endpoints of this study were:

  1. to observe the percent change in body weight
  2. achievement of 5% or more reduction in body weight after 68 weeks

What did the data show?

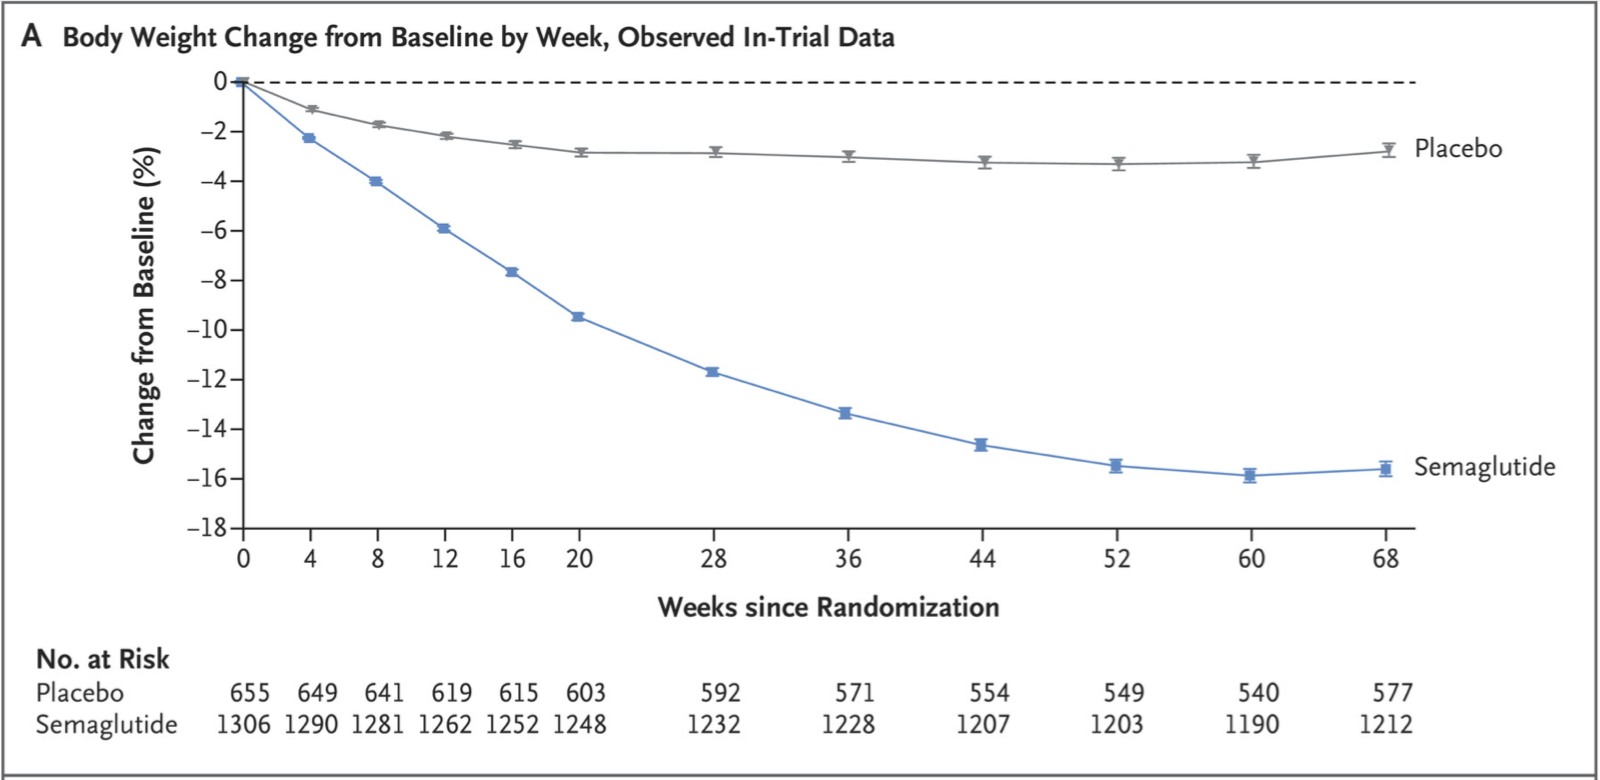
Both the primary endpoints were met. Those who got the drug lost 14.9% of their body weight, on average, compared with 2.4% among those receiving the placebo. This is a 12.4% body weight difference over 68 weeks (see below).

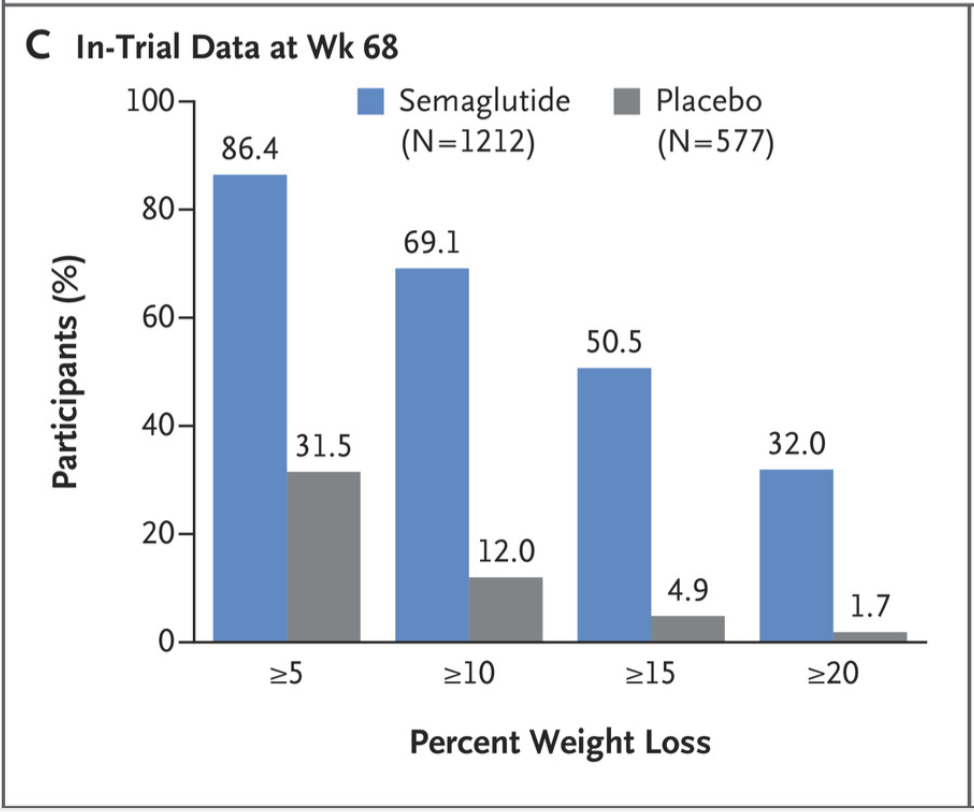
Also, compared to those who were in the placebo group, those who received 2.4 mg of semaglutide were more likely to lose 5% or more of body weight at 68 weeks. 1047 participants (86.4%) were able to achieve this threshold. The image below also shows the percentage of people that were able to lose 10%, 15% and 20% or more of body weight at the end of the trial compared to baseline.

The drug was also effective at reducing waist circumference (-13.54 cm vs. -4.13cm in placebo), BMI (-5.54 vs. -0.92) and blood pressure. Symptoms of diabetes and pre-diabetes improved in many patients.

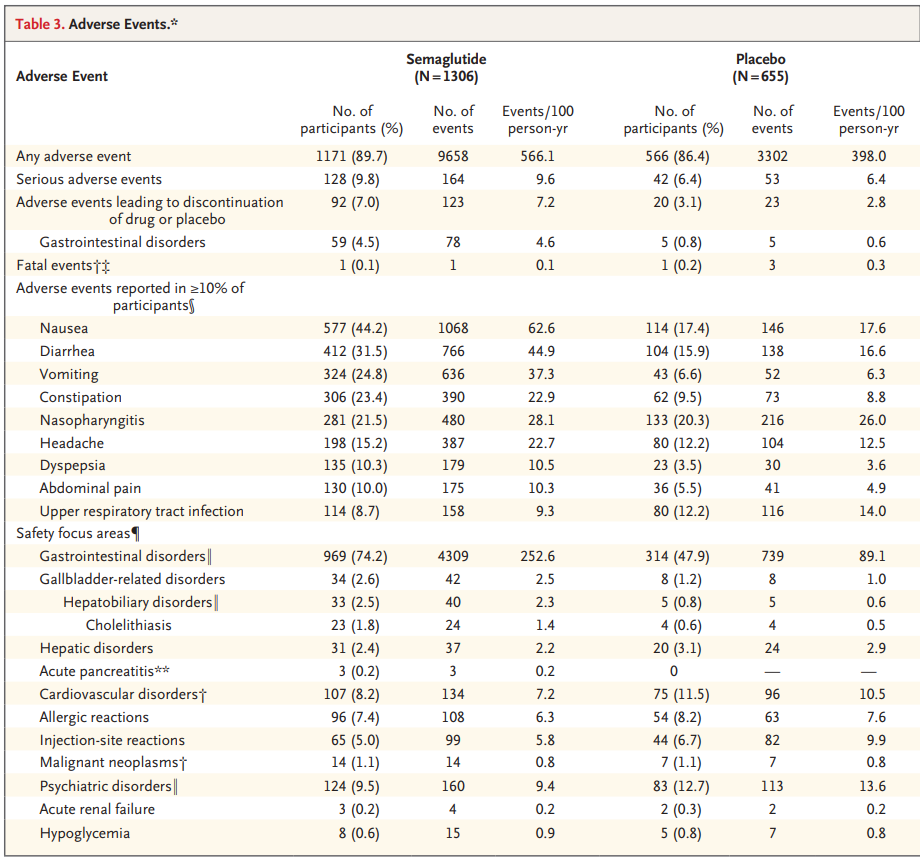
Side effects of semaglutide were relatively low as the drug showed similar adverse events to placebo. 89.7% of participants taking the drug reported an adverse event, compared to 86.4% on placebo. The most common events were nausea in 44% of patients, diarrhea in 31.5% and vomiting in 24.8%. 

How Does Semaglutide Compare to Other Weight Loss Interventions

Those who are overweight or obese are recommended to lose 10-15%, or more, of their weight. This was achieved in the semaglutide group. About 70% of participants lost 10% and ~50% lost 15%. Importantly, about 30% of participants in the experimental group, were able to lose 20% of their baseline weight. This is very significant as that much weight loss is usually seen in patients 1-3 years after bariatric surgery (surgeries on the digestive system to help with weight loss).

Phentermine, another weight loss drug, demonstrated a 7.5% drop in body weight, on average, and can be taken only for a short time. After it is stopped, the weight is regained. This is also expected with semaglutide. Patients would have to take it for a lifetime to prevent the weight loss from coming back.

Another bonus of semaglutide over current approved drug interventions is that the once weekly injection of semaglutide may increase compliance compared to other approved drugs that need to be taken several times a day.

To really understand the potential superiority of semaglutide against other treatments, head-to-head trials will need to be run. The study discussed above had a few demographic limitations as well, which included only 26% males and 75% white. These demographics are not reflective of the obese population. In the US, for example, obesity is equally prevalent in both males and females and actually more prevalent in non-white adults. According to the CDC, Non-Hispanic black adults had the highest prevalence of obesity (38.4%), followed by Hispanic adults (32.6%) and non-Hispanic white adults (28.6%).

Bottom Line: Semaglutide has shown superior efficacy and convenience with once weekly injection, compared to other weight loss treatment options. However, the drug will likely be expensive as the lower approved dose to treat diabetes costs $1,000/month.

Semaglutide is a synthetic version of a naturally occurring hormone that increases insulin production and lowers blood sugars. This slows down digestion in the stomach and lowers appetite. Because the drug is relatively new, a high-dose regimen has not been studied long enough to know if it has serious long-term consequences.

Other Diabetic Drug Showing Similar Weight Loss Results

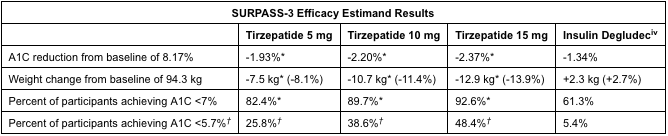
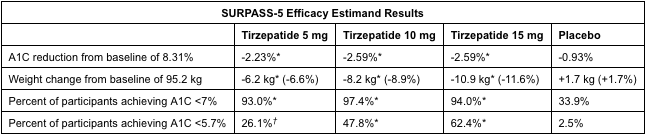
Tirzepatide, by pharma company Eli Lilly, is also being studied for use in adults with type 2 diabetes. Their clinical trials, SURPASS-3 and SURPASS-5, looked at the use of 5 mg, 10 mg, 15 mg of tirzepatide or insulin glargine (placebo) for glucose management. In SURPASS-3, the highest dose of tirzepatide (15 mg) reduced weight by 13.9% (12.9 kg) and A1C (blood glucose test) by 2.37%. In SURPASS-5, weight was reduced by 11.6% (10.9 kg) and A1C by 2.59%.

Tirzepatide, like semaglutide, is a once weekly injection. It is a dual glucose-dependent insulinotropic polypeptide (GIP) and glucagon-like peptide-1 (GLP-1) receptor agonist. Studies have shown that GIP decreases food intake and increases energy consumption which, in combination with a GLP-1 agonist, lead to significant effects on weight and glucose. The side effects reported were mostly gastrointestinal-related and mild to moderately severe.

Both tirzepatide and semaglutide are currently in ongoing clinical trials.  Tirzepatide is currently in Phase 3 for management of adults with type 2 diabetes and weight reduction. The Phase 3 SURPASS program began in 2018 and has enrolled over 13,000 participants. Results are expected in 2021.

In December 2020, the makers of semaglutide submitted an application to have it reviewed for FDA approval as a weight-loss drug. The company expects a verdict from the FDA as soon as mid-2021 and a decision in Europe by early 2022.

Both drugs seem like prospective alternatives for those who require weight management and have type 2 diabetes. Results from clinical trials show that they both significantly reduce body weight and glucose blood levels with mild side effect profiles. The next step is to hopefully get these drugs to market to provide a safe, convenient and affordable alternative to those who are overweight or obese.

A new weight-loss treatment paradigm can be upon us.

Moderna CEO Is Right, COVID Is Here To Stay

Moderna CEO Is Right, COVID Is Here To Stay

Moderna CEO Is Right, COVID Is Here To Stay

Tuesday, January 19th, 2021

  • Though pharma companies have boasted about the efficacy of their vaccines, protection for asymptomatic patients and those with milder COVID seems less effective
  • Vaccine rollout has been slow since its debut to the market and uptake is also seeing resistance
  • These factors can cause COVID to stick around forever, much like the annual flu

Last week, the CEO of Moderna warned that COVID “is not going away” and the world will have to live with it “forever”. Health experts have echoed similar thoughts, claiming that the virus will become endemic, meaning present in the population at all times. How is this plausible with Moderna and Pfizer’s vaccines showing 95% efficacy?

Like all technical topics, the devil is in the details. The vaccines are generally 95% effective, but not in everyone.

Below are a few factors that can cause COVID to stick around “forever”.

  1. Protection of Asymptomatic Patients is Still Unknown

Moderna’s vaccine showed 94.1% efficacy at preventing Covid-19 illness, including severe illness. This efficacy figure included all subgroups. However, Moderna has not completed a full analysis on the efficacy of their vaccine against asymptomatic infection. This is important because asymptomatic patients are believed to make up approximately 15% of all COVID infections.

In Moderna’s clinical trial, 38 participants in the placebo arm tested positive for COVID without exhibiting symptoms. In the vaccine arm, there were 14 asymptomatic patients. With this very limited data set, Moderna’s vaccine seems to protect asymptomatic patients, but not anywhere near 95%. The efficacy here is in the 60% range. Keep in mind, this analysis is not yet complete, and the sample size is small, so it is not conclusive.

Similarly, the Oxford/AstraZeneca vaccine reported efficacy of 70%. This figure was bundled and included analysis of four studies conducted across three countries: UK, Brazil and South Africa. Further investigation found that in those who are asymptomatic or symptoms are unknown, the efficacy drops down to just 27% (see figure below).

Pfizer has not yet released any data on the protection of their vaccine for asymptomatic patients.

Bottom Line: There’s not enough evidence yet on whether the approved vaccines prevent asymptomatic infection and transmission. The limited data on this asymptomatic patient population has demonstrated significantly lower protection than the headline figures. Asymptomatic patients make up approximately 15% of infections.

2. Protection Against Mild Infection Is Likely Lower Than 95%

Chinese company, Sinovac, came out with their vaccine candidate, CoronaVac, which the Brazilian government has given the green light for use. At first, the vaccine showed 78% efficacy. However, a follow-up trial shows that efficacy is only 50.4%. Why the significant difference?

Sinovac’s vaccine is 78% effective against mild to severe cases, but this figure does not include those with very mild infections. With this additional detail, the efficacy drops to 50.4%. The efficacy seems to decrease as the severity of COVID decreases. This means that Sinovac’s vaccine protection drops with mild cases of COVID.

This same notion could be applicable to Moderna/Pfizer. Both companies bundled their results when reporting the 95% “headline” efficacy. They have yet to release protection by severity of disease.

3. Rollout Has Been Slow & Uptake Is Seeing Resistance

According to the Bloomberg Tracker, there have been more than 44 million shots administered in 51 countries. Though that may seem like a large absolute number, as a proportion of the population, the figure is quite low. Distribution and administration of the vaccine, in the US/EU, at least, has been underwhelming.

The US began rolling out the vaccine to front-line healthcare workers on December 14 and has already reached 14.7 million doses. One country that has really stood out in the crowd is Israel. They have administered over 2.5 million doses with a population of just 9 million, compared to the US with a population of over 300 million. To look at it from a fairer comparison, per 100 people, the US has vaccinated 4.48 people versus Israel who has vaccinated 28.52. That is nearly 6x more vaccinations per 100 people.

At the current pace of vaccination, the US is expected to reach herd immunity in 558 days (approximately 1.5 years) in mid 2022.

Not only has the rollout of the vaccine been slow but its uptake is also seeing resistance. Many are worried about its production, claiming that it made it to market way too fast. To read more about the new technology used to develop the vaccine, read LifeScite’s Moderna and Pfizer Challenge the Status Quo with New mRNA Vaccine Approach.

One study of 18,000 adults across 15 countries found that on average, 73% of participants would get a COVID vaccine. However, this percentage is down from 77% (August), especially in China, Brazil, Australia and Spain.

What we know for sure is that all the vaccines are very effective at protecting against severe infection. What we need now is more comprehensive data on specific subgroups of infections, such as asymptomatic and less severe disease.

Early and limited data shows that protection is lower in mild/asymptomatic disease. This will limit COVID but not eradicate it. It should not be a surprise because the annual influenza virus (flu) has become endemic, and it seems COVID will also.

The Government Measures Most Effective At Limiting COVID Spead

The Government Measures Most Effective At Limiting COVID Spead

The Government Measures Most Effective At Limiting COVID Spread

December 28, 2020

  • A study analyzed the most effective interventions at lowering the spread of COVID
  • Closing all educational institutions, limiting gatherings to 10 people or less, and closing face-to-face businesses each reduced COVID transmission considerably. The additional effect of stay-at-home orders was comparatively small.

Most countries have implemented lockdown interventions this holiday season to halt the spread of COVID. This article will analyze the effectiveness of certain lockdown interventions. The analysis is sourced from a study that measured the effectiveness of lockdown measures (ie. closing all educational institutions, limiting gatherings to 10 people or less, etc). Data was collected from 41 countries during January – May 2020. The premise of the study was to see whether or not individual lockdown policies were able to lower the reproduction number, Rt, over time.

To read the preceding article about which countries were most impacted economically, check out LifeScite’s Debunked: Economic Implications of COVID Lockdowns.

What is Reproduction Number (Rt)?

Rt measures how many people get infected from the spread of the virus. For example, if Rt is 4.0, then one infected person will spead the virus to 4 other people (see image below). The goal is to get Rt lower than 1.0, which would mean that each infected person spreads the virus to less than one other person. This is how the spread of a virus is stopped. For comparable purposes, the COVID Rt number in the US is approximately 1.01. Click HERE to see estimates of Rt in each state.

Most Effective Measure: Limiting Gatherings

The effectiveness of each lockdown measure was expressed as a percentage reduction in Rt (see image below). The % reduction in Rt for each measure was:

  • Limiting gatherings to 1,000 or less: 23%
  • Limiting gatherings to 100 or less: 34%
  • Limiting gatherings to 10 people or less: 42%
  • Closing high risk face-to-face businesses: 18%
  • Closing non-essential face-to-face businesses: 27%
  • Closing schools & universities: 38%
  • Stay at home order: 13%

The results show that limiting gatherings and closing of businesses were effective interventions at reducing virus transmission. It might be thought that closing all non-essential businesses might be more effective than targeted closures, but the results show that they were only slightly more effective.

In fact, targeted closures like those with a high infection risk (ie. bars and restaurants) might be a more promising option in some cases.

Limited gathering to a maximum of 10 people was the most effective number, versus 100 or 1000 people. However, it is important to note that the data used in this study was collected during a time (Jan-May) where gatherings were likely already indoors because of the weather. The study also found that closing schools and universities in conjunction had a robust effect though their individual effects were not distinguishable since they closed around the same time.

Bottom line: The most effective lockdown intervention was limiting gatherings to 10 people or fewer. The least effective lockdown intervention was stay-at-home orders.

Combining Lockdown Interventions Lowered Rt by 77%

The effectiveness of lockdown policy combinations was also evaluated and found to have a 77% reduction in Rt.  

Across all countries studied, the mean Rt without any measures was 3.3. Starting from this number, the estimated Rt likely could have been brought below 1.0 by implementing at least 3 lockdown policies: closing schools and universities, high-risk businesses, and limiting gathering sizes to at most 10.

Bottom Line: Implementing a combination of the 3 most effective lockdown interventions could lower Rt below 1.0. These are  limiting gatherings to less than 10 people, closing all schools & universities and closing high-risk non-essential businesses (ie. bars, restaurants, gyms).

Although, the results provide us with certain insights on the effectiveness of several lockdown measures on COVID transmission, there are limitations to this study:

  1. The effectiveness of the measures studied depends on the context of their implementation (ie. implementation of other interventions, the countries’ demographics etc)
  2. The study did not take into consideration certain interventions with already promising results (ie. testing, tracing and case isolation)
  3. Rt may have been reduced by behavioural changes and unobserved interventions such as wearing masks

Lowering Rt can be achieved through the implementation of at least 3 measures. The most effective interventions to minimize the spread of COVID are limiting gatherings to less than 10 people, closing all schools & universities and high-risk non-essential businesses.

Debunked: Economic Implications of COVID Lockdowns

Debunked: Economic Implications of COVID Lockdowns

Debunked: Economic Implications of COVID Lockdowns

December 17th, 2020

  • Lockdown policies have a negative economic impact on GDP. The most open countries experienced an average GDP increase of 2.85%, while the most restricted countries saw GDP decline by an average of 6.50%
  • Lockdowns did not have a material impact on the unemployment rate. In fact, the countries with stricter lockdowns experienced a smaller jump in unemployment rate than countries that remained open
  • Lockdown impact on health is not as conclusive, mostly because cases & deaths are not an accurate measure. This is due to countries enforcing lockdowns to halt the spread of COVID after an outbreak

To shut down or not to shut down. That has been a topic of debate amongst policymakers with the spread of COVID. Below, an analysis is performed assessing how the economies of each country performed given the lockdown measures they took.

It is presumed that countries must decide between economy or health. Data shows that this trade-off is partly true. The sweet spot is somewhere between stay-at-home orders and complete mobility.

Methods Used for Measuring Impact

Mobility & strictness of lockdown: Google’s Community Mobility Report was used to measure the lockdown severity of each country. This “mobility index” tracks the sum of movement trends in workplace and residential areas, as of December 11, 2020.

Economic measures: Year-over-year GDP change was the first economic metric used to measure the impact of lockdowns. The change in the unemployment rate during 2020 was the second economic metric analyzed. How much the unemployment rate changed from the most recent data available for 2020, compared to the start of 2020.

Health measures: The number of COVID cases per million population was one health metric used. This is the number of people infected with COVID-19 for every million people in the population. The other was death rate per 100K population, the number of people that died for every 100,000 people in the population.

A quadrant matrix for each above metric is used to visually represent rankings.


Economic Data

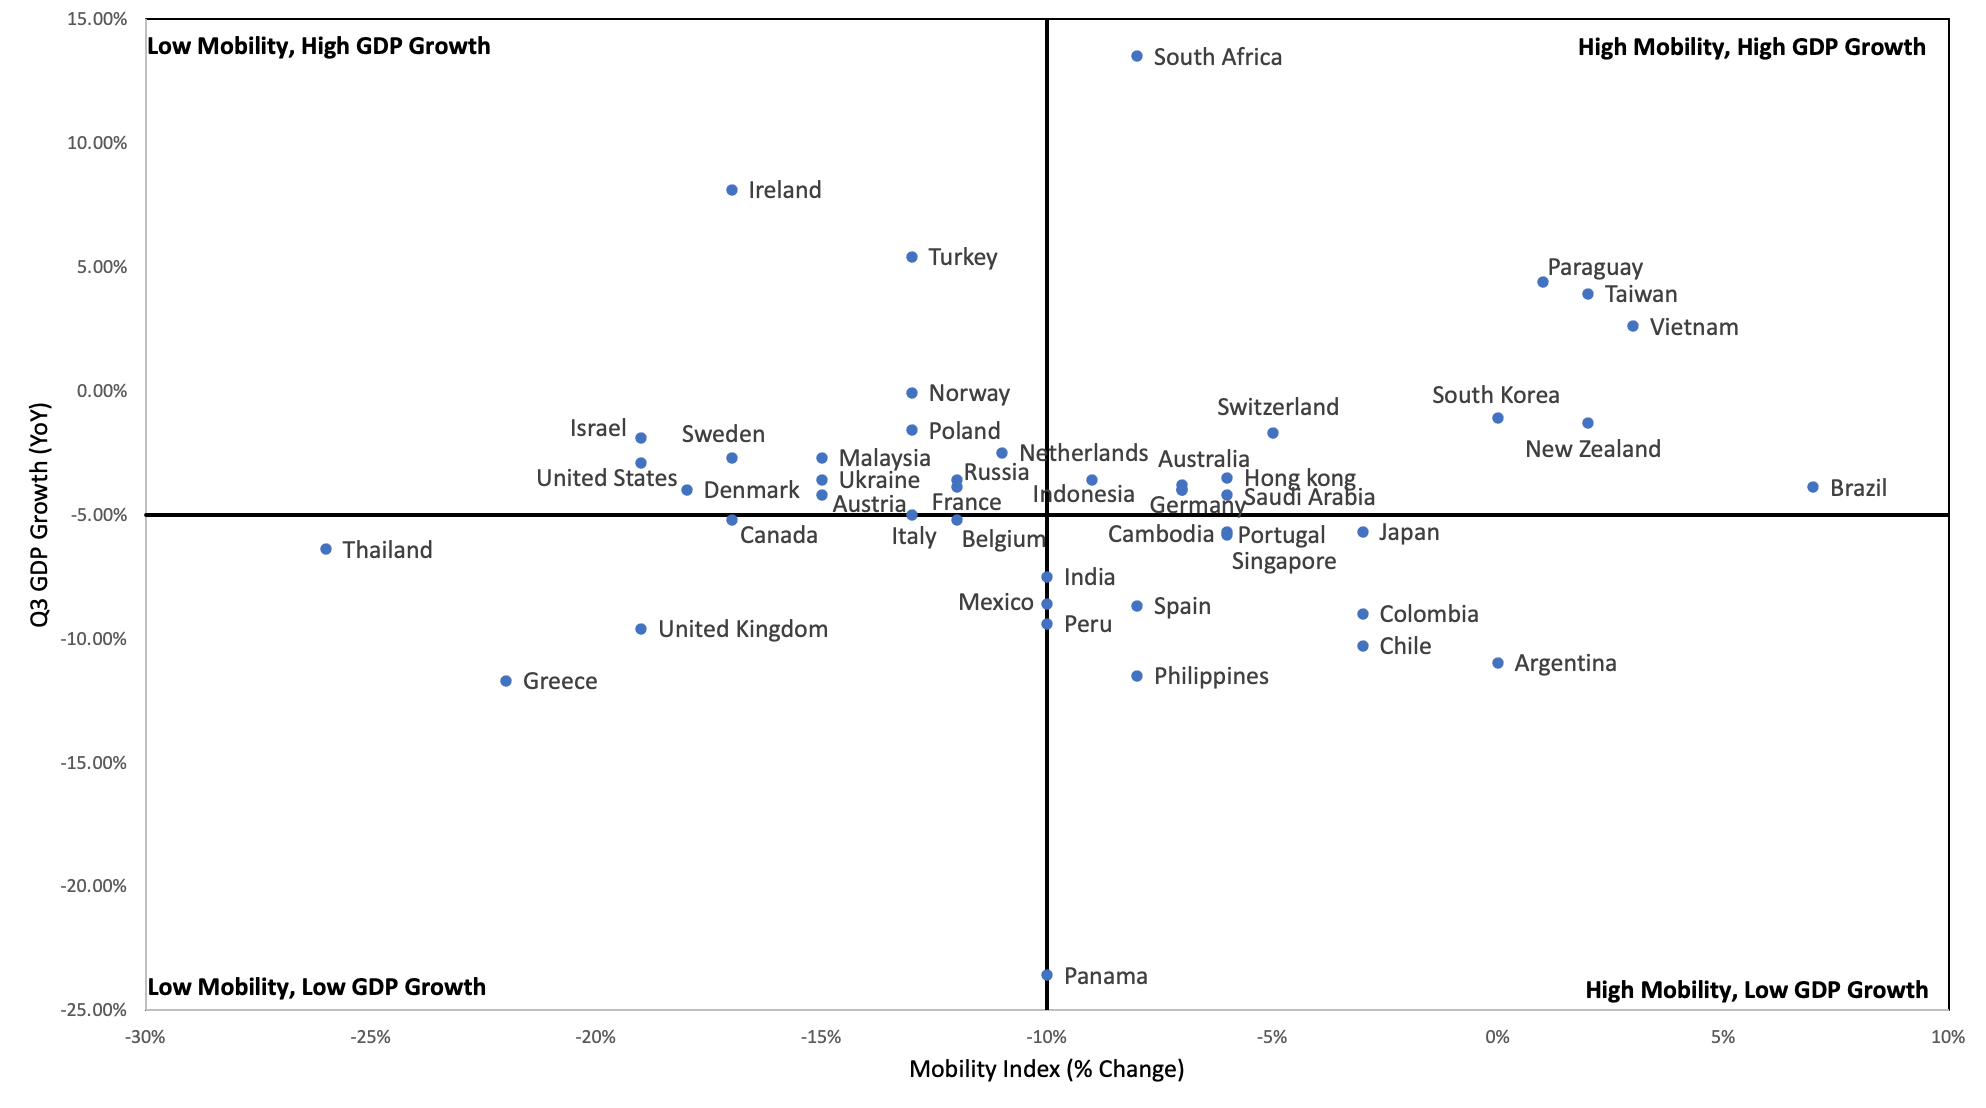
Mobility index compared to the Q3 GDP growth (year over year)

A low mobility index is representative of countries that took stricter lockdown measures versus those that did not. The higher the mobility index, the fewer restrictions because there was more movement in workplaces and residential areas. The GDP is a percent change in GDP compared to the same time last year (Q3 2019).

The top left quadrant shows the countries that had a low mobility index and a relatively high GDP growth. Ireland and Turkey were able to grow their GDP despite being locked down. The top right quadrant shows that Paraguay, Taiwan and Vietnam had a high mobility index while still maintaining GDP growth.
The bottom left quadrant shows the countries that were under lockdown (low mobility) and had a decline in their Q3 GDP. The U.K. and Greece were the most impacted economically by their lockdowns. The bottom right quadrant shows the countries that were relatively open and had GDP declines (ex. Argentina, Chile and Colombia).


The belief is that if a country goes through a lockdown (low mobility), the economy is going to see a negative impact and therefore result in a greater GDP decline. Less movement should lead to less economic growth.

The data supports this notion. The top 10% of countries with highest mobility saw GDP increase an average of 2.85%. The bottom 10% of countries with lowest mobility saw GDP decline an average of 6.50%.

There is a clear correlation between lockdowns and GDP decline. The most open countries experienced an average GDP increase of 2.85%, while the most restricted countries saw GDP decline by an average of 6.50%. Locked down economies suffer more productivity loss than the economies that remain open.

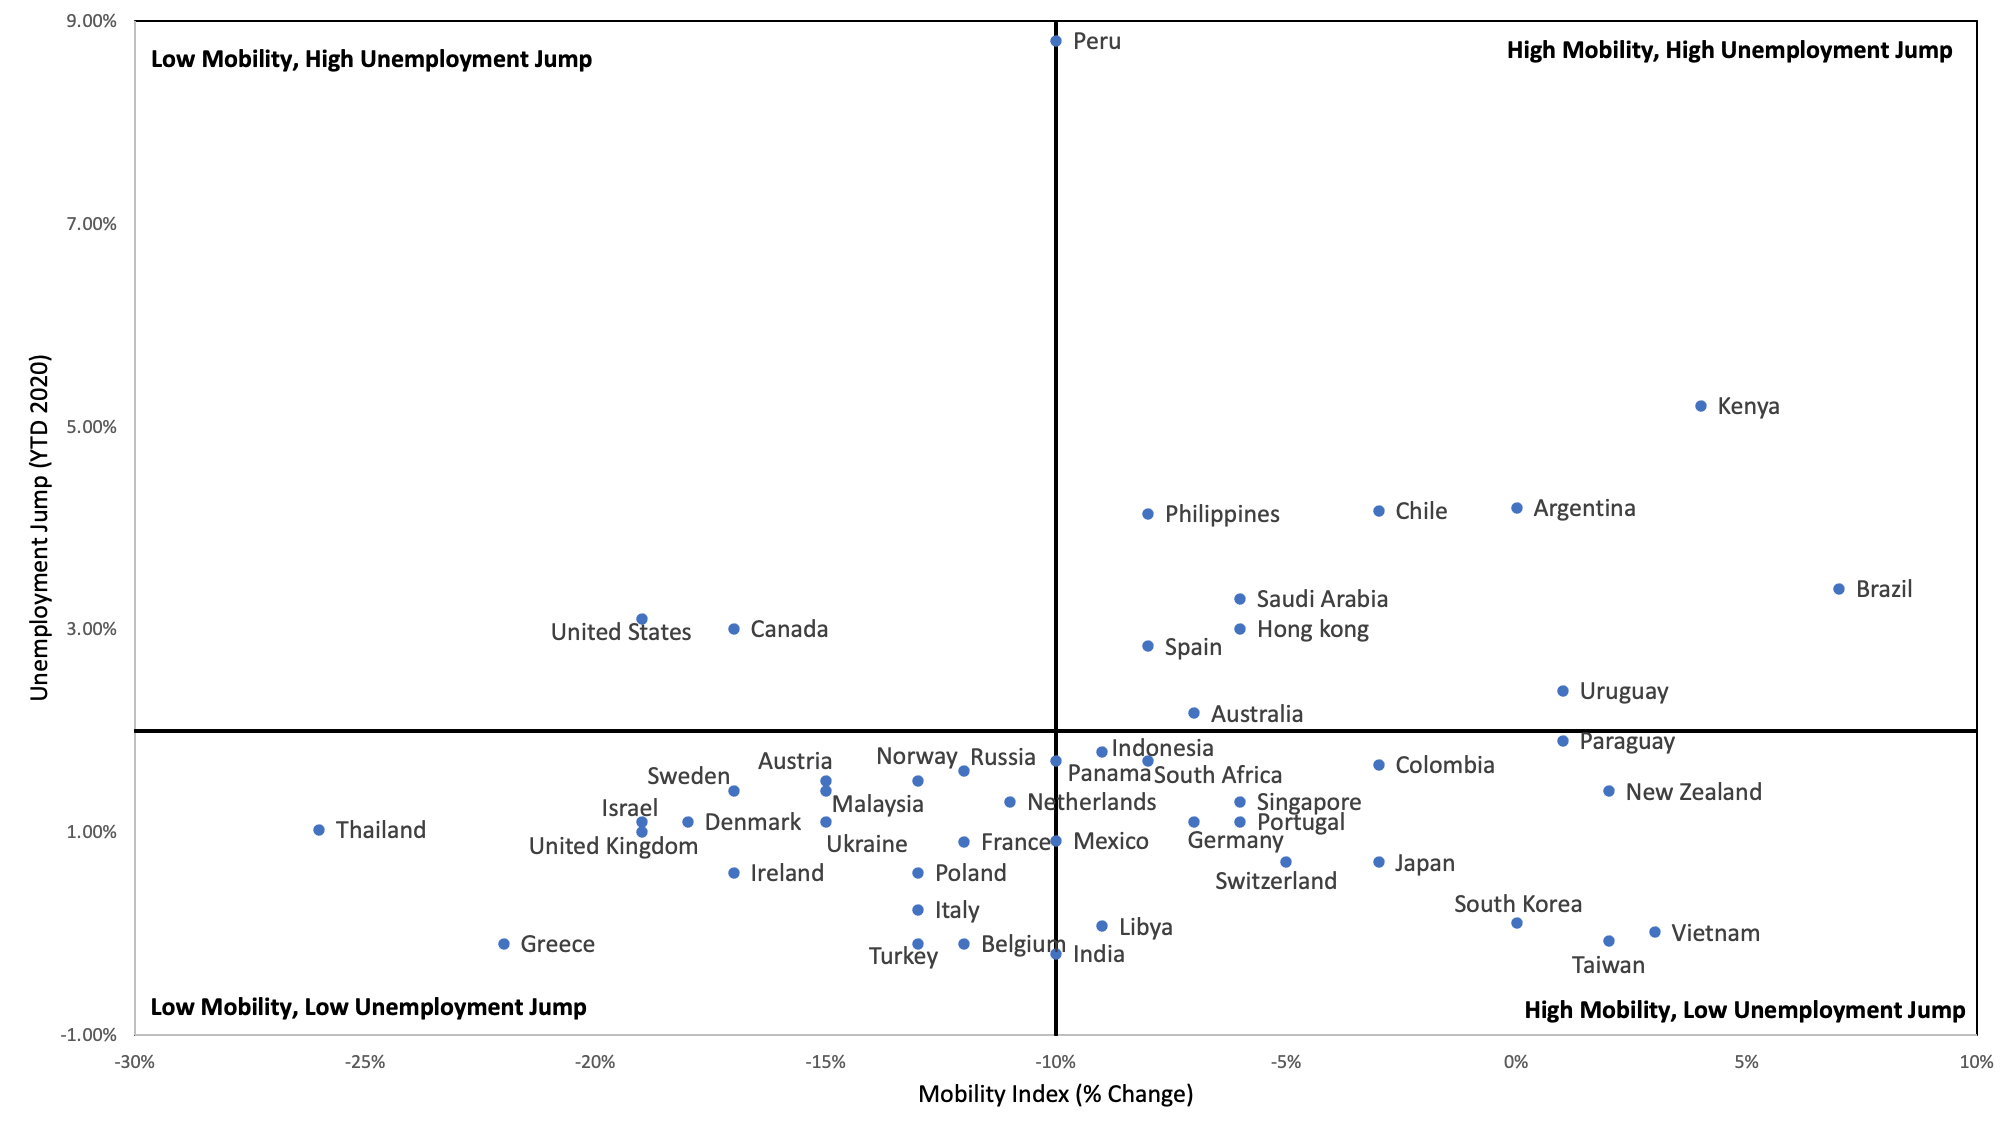
Mobility index compared to the change in unemployment rate (year to date 2020)

The jump in unemployment is the difference between the unemployment rate at the beginning of 2020 versus the most recent 2020 figures. The most recent unemployment data ranges from Q2 to November unemployment numbers.

Top left quadrant shows that the United States and Canada had a low mobility index and a high unemployment jump. This means that these countries went into lockdown and thus, the highest proportion of people lost their jobs. Top right quadrant shows that Brazil and Kenya were unable to maintain their jobs despite not being under strict lockdown policies.
Bottom left quadrant shows the countries that were under lockdown and were able to keep their job markets relatively stable. Belgium and Turkey kept their unemployment rates the same as before COVID, even with a decline in mobility. Bottom right quadrant shows the countries that were not under strict lockdown and kept their job market relatively stable. Vietnam and Taiwan did not see a change in unemployment rate during 2020.


On average, unemployment was not impacted by mobility. This can most likely be attributed to work-from-home policies, which had a large number of people remaining employed even with offices being shutdown.

The top 10% of countries with the highest mobility saw unemployment rate increase by an average of 1.99% in 2020. The bottom 10% of countries with lowest mobility saw unemployment rate increase by an average of 1.22%.

Lockdowns did not have a material impact on the unemployment rate. In fact, the countries with stricter lockdowns experienced a smaller jump in unemployment rate, than countries that remained open. Technological advances and work-from-home policies are two factors that positively impacted unemployment, and as a result, saved many jobs that would have otherwise been lost.   

Healthcare Data

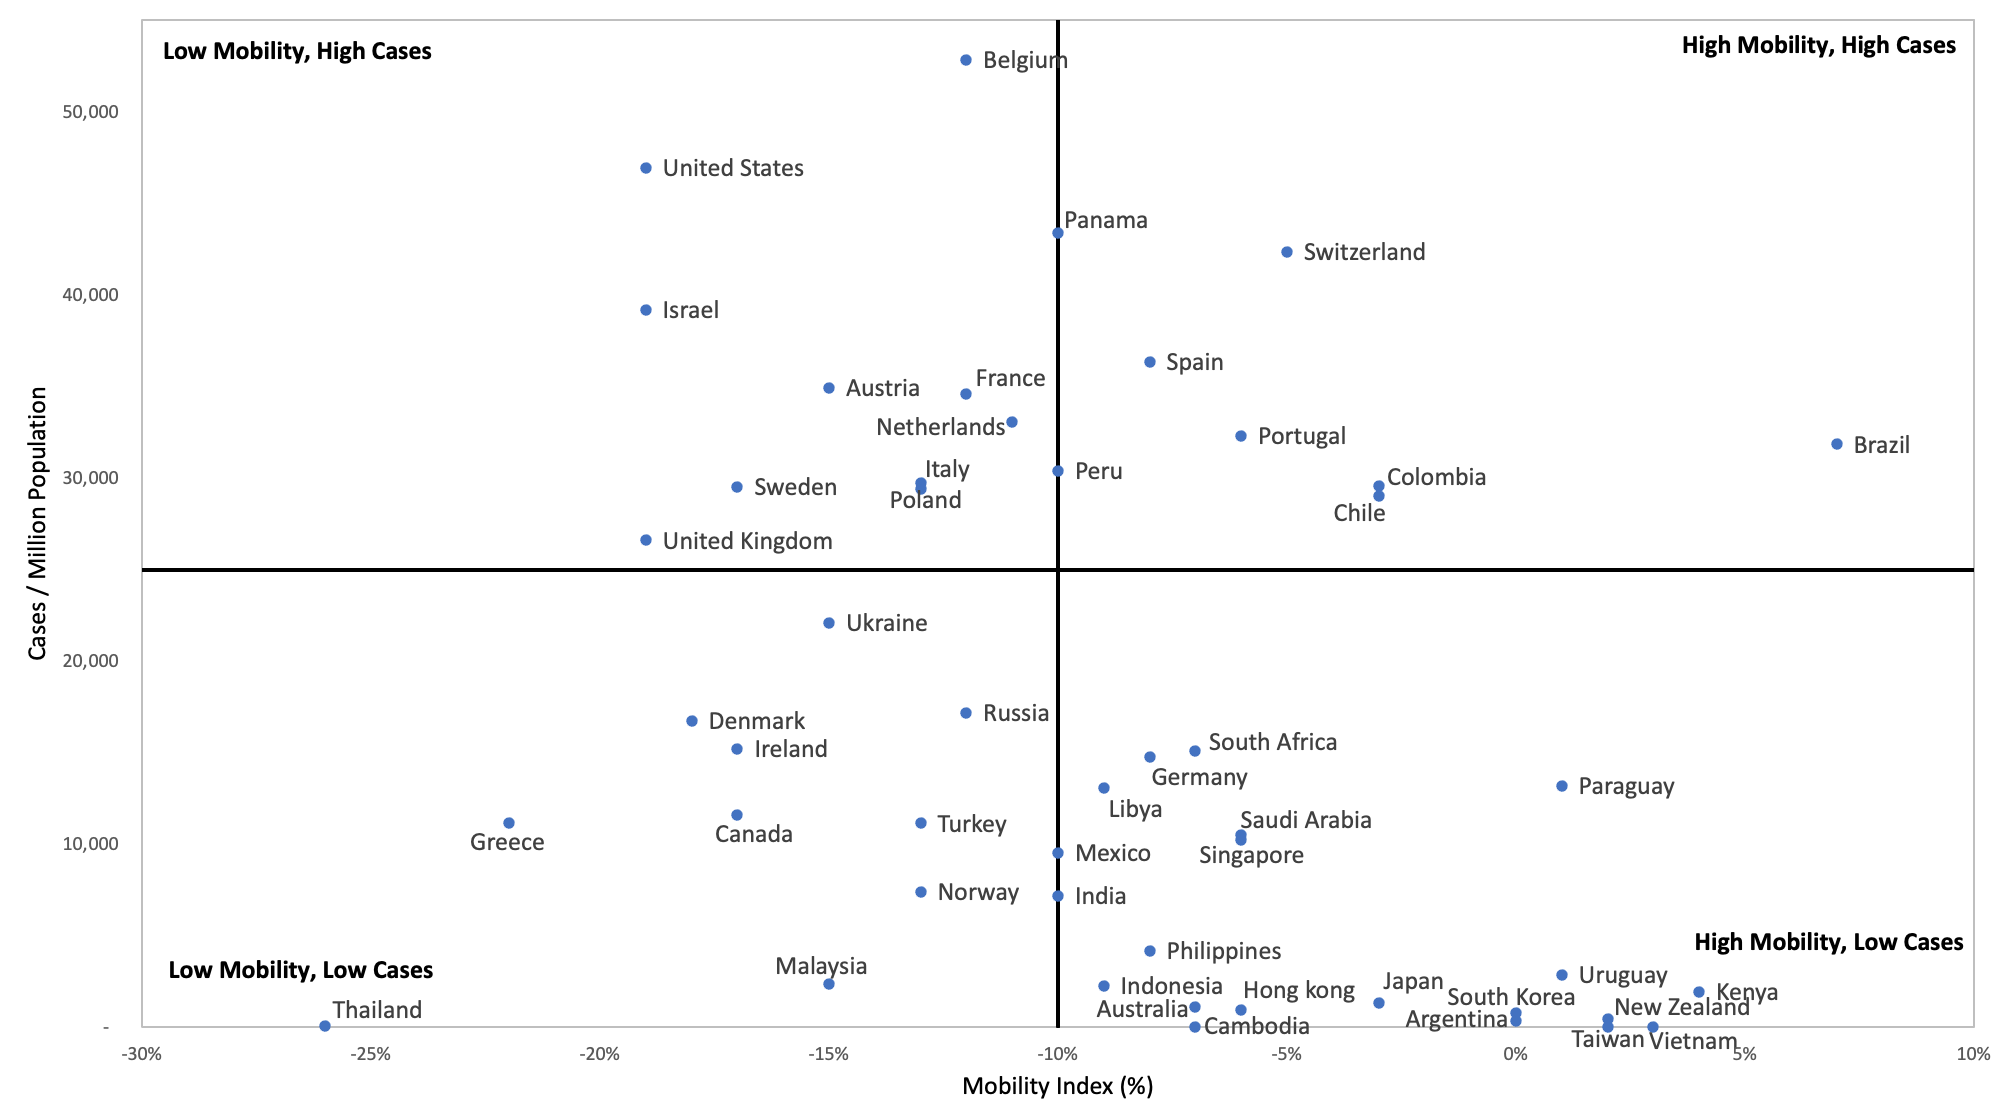
Mobility index compared to COVID cases/1M population

This graph compares the mobility index with the number of COVID cases/million population. The number of cases/million people is the number of people infected with COVID-19 for every million people in the population. The higher the number, the more COVID cases the country was seeing per capita.

Top left quadrant shows that countries like Israel and the U.S.A, with strict lockdown measures, still had a high number of relative COVID cases. Top right quadrant shows that Brazil and Chile had a high mobility index and as expected, a high number of cases. More movement = more transmission.

Bottom left quadrant shows the countries that maintained a lockdown and were able to keep their COVID cases relatively low. These countries included Thailand and Greece.

Bottom right quadrant shows the countries that were not under strict lockdown and had low cases. New Zealand, Taiwan and Vietnam were able to maintain a low case number despite not being locked down.


According to the data shown on the graph, mobility had no correlation to the number of cases. In fact, the opposite is seen. More lockdown = more cases. This is likely due to lockdown measures being taken as a reactive measure to rising cases. When cases are on the rise, policymakers take actions to restrict movements to halt the spread of COVID.

The top 10% of countries with highest mobility saw an average of 6,843 cases/1M people. The bottom 10% of countries with lowest mobility saw an average of 24,784 cases/1M people.

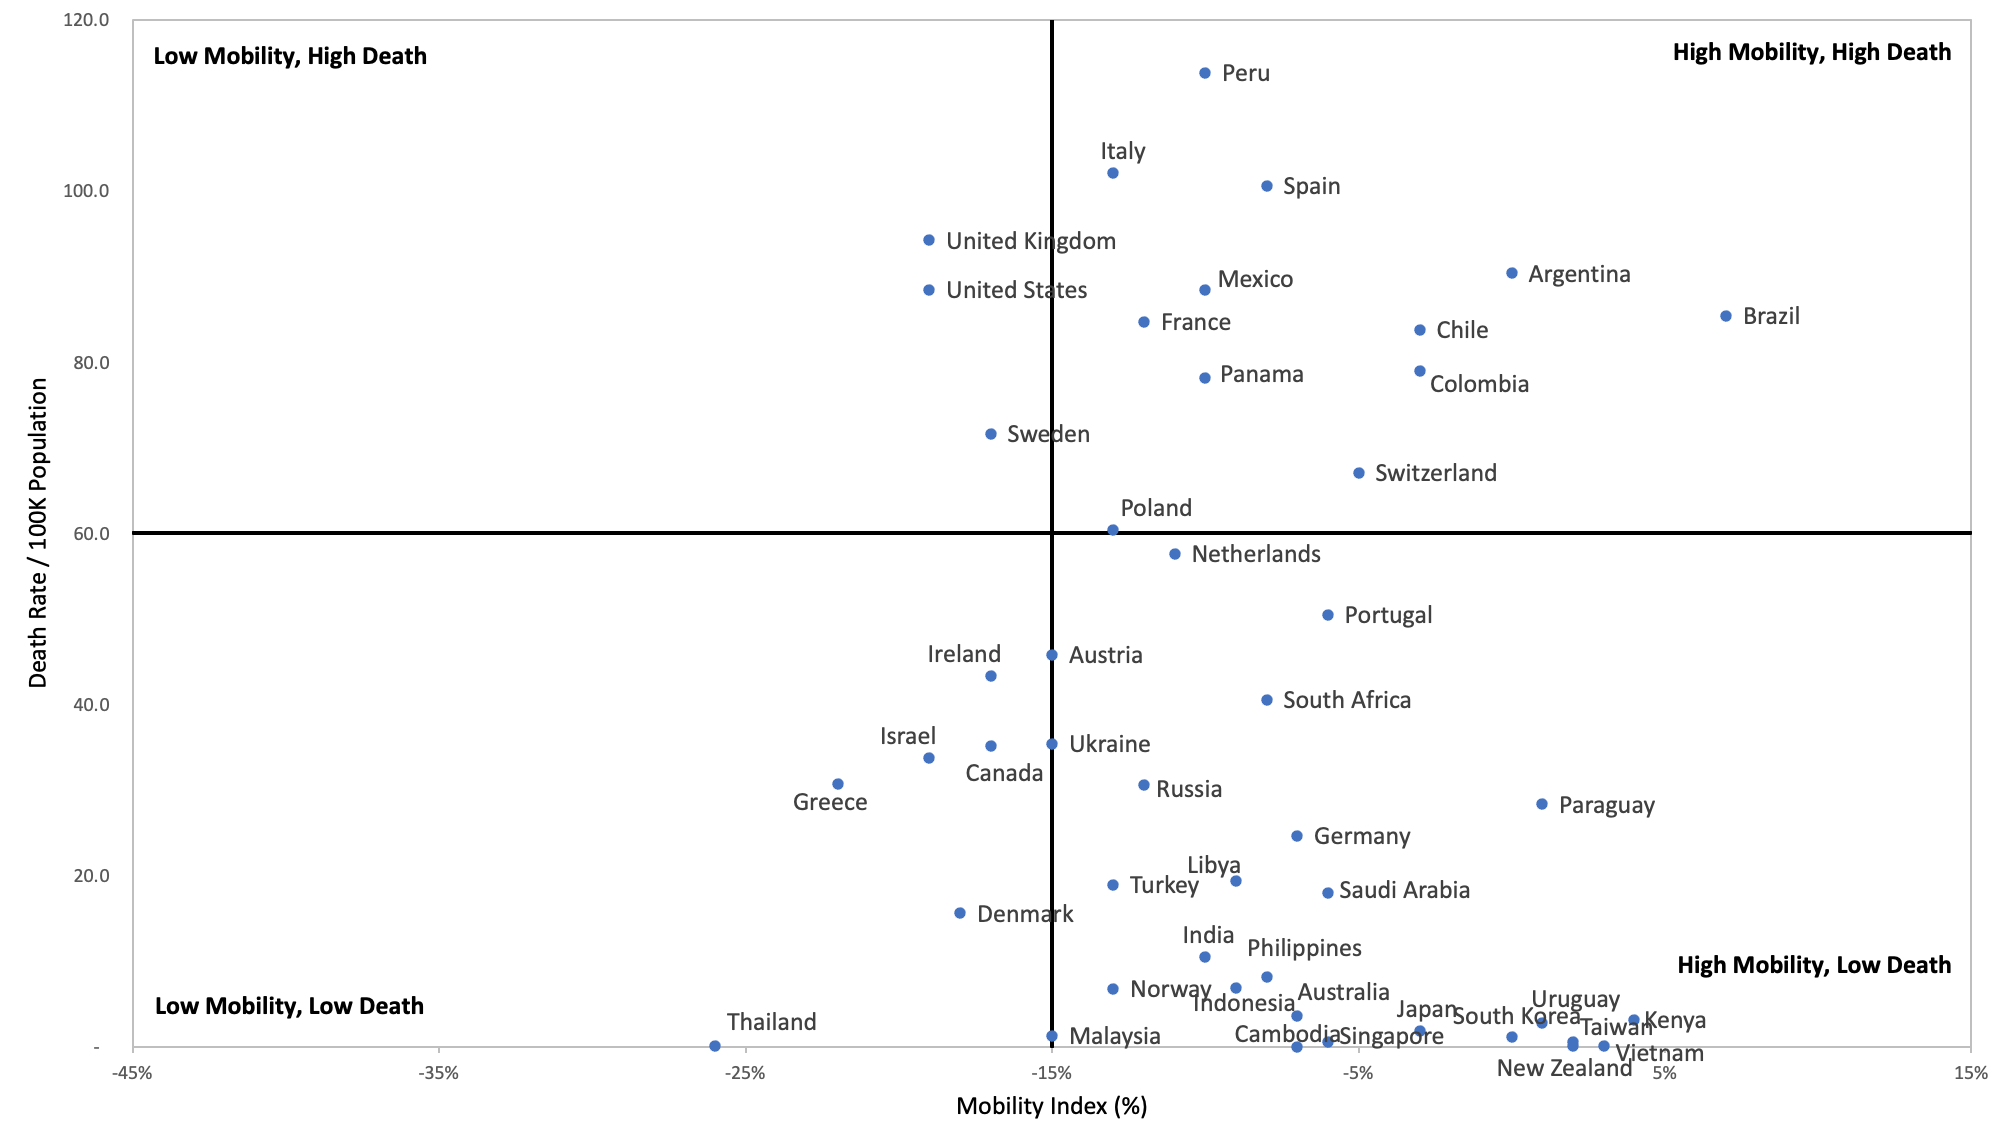
Mobility index compared to COVID death rate / 100K population

This graph compares the mobility index with the death rate/100K population. The death rate/100K population is the number of people that died for every 100,000 people in the population.

Top left quadrant shows that the U.S.A and U.K. had a high death rate despite being under lockdown (low mobility). Top right quadrant shows that were not under strict lockdown and had a high death rate.

Bottom left quadrant shows the countries that maintained a low death rate while under lockdown (ie. Thailand, Denmark).


Bottom right quadrant shows the countries that were able to maintain a low death rate despite not being under strict lockdown (ie. New Zealand, South Korea, Taiwan, Vietnam).


Like the number of cases, countries with stricter lockdown measures have higher death rates than countries with fewer restrictions. This is another metric that is greatly impacted by the reactive policies to rising cases.

The data shows that the top 10% of countries with the highest mobility saw an average of 27 deaths/100K population. The bottom 10% of countries with the lowest mobility saw an average of 49 deaths/100K population.

Data Limitations

The data in the matrices above is a helpful visual representation of the general impacts that lockdown has on health and the economy. It shows how different countries who locked down compare to those that didn’t. However, there are limitations to the data:

  1. Google’s mobility is tracking the movement in places classified as “workplace” and “residential”. This does not take into account retail, transit stations, parks. So not the most accurate measurement of mobility.
  2. Google’s Mobility index is a dynamic metric that changes frequently. Countries are shifting between lockdown and no lockdown, which in turn effects their Mobility index.
  3. GDP/unemployment are not perfect measures of economic output.
  4. Cases/deaths are generally seen as reactive metrics that countries use to make policies. Many countries went into lockdown only after seeing cases spike.

Overall, the above data shows that enforcing lockdown policies has a negative economic impact on GDP, but not unemployment. The impact on health is not as conclusive, mostly because cases & deaths are not an accurate measure. This is due to countries enforcing lockdowns to halt the spread of COVID after an outbreak.

The follow-up article will analyze the effectiveness of lockdowns on halting the spread of COVID.